How would you describe your budgeting style?
A) I know what I spend to the penny
B) I have a pretty good idea where my money is going
C) I have good intentions…
D) Ha! What budget?
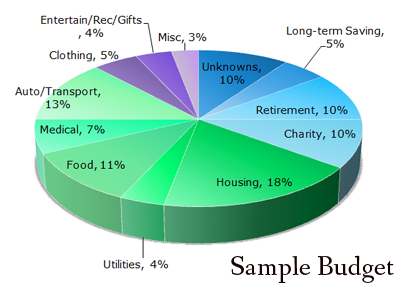
Some people advocate budgeting down to the penny. That means you will know where all your money is going, but most people have trouble going to that level of detail. If you budget to the penny, good for you. Pat yourself on the back, and feel free to go read something else – you probably don’t need this guide (or just admire my pretty chart below and move on). If balancing to the penny isn’t you, keep reading.
Please know that I think it is very important to know what you are doing with your money. Even if you just have an idea of where your money is going, you should still have a very good idea. No one wants to run out of money, and with a little thinking and planning, you can figure out how much you want to spend on what.
First, see the other Bucket List articles for explanations of (and, hopefully, motivation for) the saving categories. If you save 10% for unknown unknowns, 5% for future big ticket/large items, 10% for retirement (or financial independence), and 10% for charity, you have 65% remaining for everyday expenses.

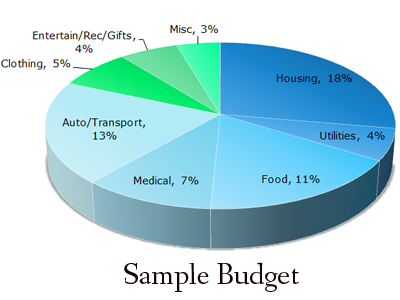
Let’s break down that 65% into a sample budget:
Housing: 18%
Utilities: 4%
Food: 11%
Medical: 7%
Auto: 13%
Clothing: 5%
Entertainment/Recreation/Gifts: 4%
Miscellaneous: 3%

My sample budget assumes that you don’t have any debt, and of course, you will have to sit down and think about your own priorities. Everyone has a slightly different idea of what the most important things are.
Before you give up, I suggest sitting down and creating a budget, roughly based on your lifestyle. Figure out which expense categories are fixed and work from there. Also consider your “fixed” expenses. Are those actually fixed, or can you find a cheaper option?
Obviously the largest percentage is housing. If you live in a large city, 18% of your budget on housing sounds ridiculously small. Consider where you are living, if you have (or could add) roommates to help cut the cost down, and if you know you can’t find a better housing deal, then adjust your budget accordingly.
Once you’ve set your budget, move to the next step: tracking your expenses for a month or two. You can use a free service such as Mint.com, or purchase software such as Quicken. Or keep your own log using bank and credit card statements, a checkbook, and Excel. I find that using something like Mint or Quicken that keeps track of my expenses with minimal input from me is easier. Automating much of the input process means I have the energy to analyze what I’m doing, instead of expending it all on tracking the expenses item by item.
Then compare your sample budget and your actual spending. Do you find you overspend your clothes budget but underspend your food budget? Adjust the percentages (or decide to spend less on clothes in the future) and move on!
Sticking to a budget sounds daunting, but it’s really just a tool to help you not spend more money than you make, and it also tells you how much money you can spend without worrying that you are going to keep working until you are 95 to make ends meet (unless you want to keep working until you are 95 – but you still should spend less than you earn).
Another great thing about budgets is that once you get into a routine, you become used to a lifestyle and may not need to check your budget as often. As with most things, beginning is the hardest step.
Other Bucket List Articles:
Bucket for the Unknown
Financial Independence Bucket
Saving & Investing Bucket
Living Within Your Means Bucket
OTHER SAMPLE BUDGETS:
One of David John Marotta’s sample budgets:
Retirement saving, Long-term saving, and Charitable giving: 35%
House/Rent: 15%
Utilities: 5%
Food: 16%
Clothing: 4%
Auto: 12%
Medical: 7%
Recreation: 3%
Frivolous: 1%
Christmas/Birthday/Gifts: 2%
Crown Ministries offers sample budgets for singles and young married couples.
SINGLE PERSON:
Savings, Charitable Giving, Long-term saving and investing: 28%
Leaving 72% for everyday expenses:
Housing: 22%
Food: 6%
Clothing: 5%
Auto: 20%
Insurance: 4%
Debts: 5%
Entertainment/Recreation: 10%
Medical: 3%
Misc.: 7%YOUNG MARRIED COUPLE:
Savings, Charitable giving, Long-term saving & investing: 20%
Leaving 80% for everyday living:
Housing: 30%
Food: 11%
Clothing: 7%
Auto: 13%
Insurance: 5%
Debts: 5%
Entertainment/Recreation: 7%
Medical: 4%
Misc: 8%
Sample Budget 3:
15% Emergency & Long-term Savings
10% Retirement Savings
10% Charitable Giving
20% Housing
13% Food
4% Clothing
4% Utilities
12% Automobile/Transportation
7% Medical
4% Entertainment
1% Gifts, Miscellaneous
Photo by Changeable Focus used under Flickr Creative Commons license.
2 Responses
Mike
Are these a percentage of gross income or net of taxes?
Chris
The incredible percentage of taxes I pay of my hard-earned income is charity enough! That 10 percent is going into my financial independence bucket…