Every time the S&P 500 hits new highs everyone wonders if these new highs will stick.
On February 17, 2015, the S&P 500 broke 2,100 for the first time.
Because the markets have an upward trend, for any arbitrary value of the stock market, all we know for certain is that it will ultimately cross that value an odd number of times, finally settling above the line and continuing its upward trend.
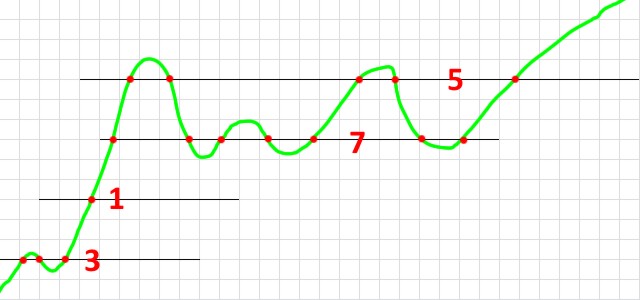
Here are four arbitrary values which are each crossed an odd number of times:

As you can see, the first line is crossed 3 times while the second line is only crossed once. We would prefer that every new high in the stock markets is only crossed once as the markets steadily appreciate in a well-behaved manner. None of us like volatility. I’ve even had someone ask why the government doesn’t just legislate that the stock market can’t go down! We don’t like the third and fourth lines where the markets go up and down, crossing each arbitrary value 7 and 5 times respectively. To the average investor, these represent choppy, ill-behaved markets where volatility is the rule rather than the exception.
I decided to analyze exactly what percentage of new highs are permanent and the markets never drop below that value again.
I analyzed the 16,431 trading days between 1/3/1950 and 4/22/2015, using closing data only and did not pay any attention to volatility during the trading day
The percentage of days where the S&P 500 set a brand-new high was 6.96%. Put into annual terms, that’s about 25 days every year.
However, the percentage of days where the S&P 500 set a new high and the markets never fell back down was only 0.24%.
That means that the odds that a new market high will stick are only 3.50%.
This happens less than one day a year. In fact, it has only happened 40 times since 1950.
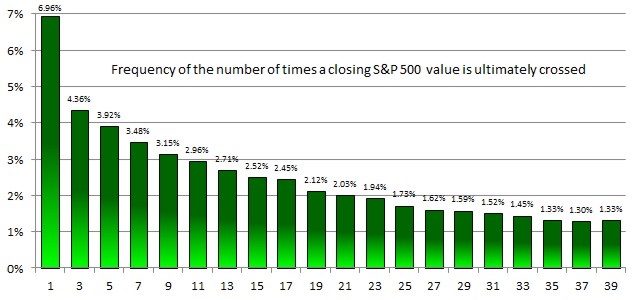
I decided to analyze just how noisy the markets are and looked at every day’s close to see if this was the first, third, fifth or seventh time the stock market had reached a certain point. Here are the odds for each number of crossings:

The S&P 500 set a new high on 6.96% of all trading days. In almost all (96.5%) of those cases, it subsequently dropped back below the new record it set.
When the S&P 500 hit the new all-time high of 2100 in February, the financial news covered the story as a historic moment.
Since setting the new high of 2100 on February 17, 2015, the S&P 500 dropped back down the very next day (2/18/2015). It rose back up on 2/20/2015 to 2100. And it dropped again on 3/4/2015. It rose back to 2100 on 3/5/2015, fell below on 3/6/2015, rose back to 2100 on 3/20/2015, fell below on 3/24/2015, rose to 2100 on 4/10/2015, fell on 4/13/2015, rose on 4/15/2015, fell on 4/17/2015, rose on 4/20/2015, fell on 4/21/2015, rose on 4/22/2015, fell on 4/30/2015, rose on 5/1/2015, fell on 5/5/2015, rose on 5/8/2015, fell on 5/12/2015, rose on 5/14/2015, fell on 6/4/2015, rose on 6/10/2015, fell on 6/12/2015, rose on 6/17/2015, fell on 6/29/2015, rose on 7/14/2015, fell on 7/24/2015, rose on 7/29/2015, fell on 8/2/2015, rose on 8/10/2015, and fell on 8/11/2015.
Since the moment when the S&P reached 2100, its value has fluctuated below and above 31 times. It will continue to do so before the market rises above this level on any permanent basis. This pattern will hold the next time the stock market hits a new “historic” high.
Market volatility is a given and should be expected. Most reporting on the state of the stock market is just noise – records will continue to be set, fallen short of, and surpassed. None of it means that you should abandon your diversified asset allocation to follow the hot trend. Just rebalance and relax.
Photo used here under Flickr Creative Commons.