 Diversifying your portfolio means finding assets that have value on their own merits but do not move exactly alike. A critical investment metric called “correlation” is used to construct a portfolio most likely to meet your personal financial goals.
Correlation measures how much two different investments move together, measured on a scale of positive one (+1) to negative one (-1). A perfect correlation (1.00) would mean that both investments always move in the same direction with the same magnitude. A perfect inverse correlation (-1.00) would mean that two assets always move in opposite directions.
Correlation comes into play at three levels of investment allocation: stocks and bonds, asset classes and sectors of the economy. At each level it can provide you with a better chance of boosting your returns and protecting your investments. But the way correlation is used is different at each level. In this column we will cover its use at the highest level.
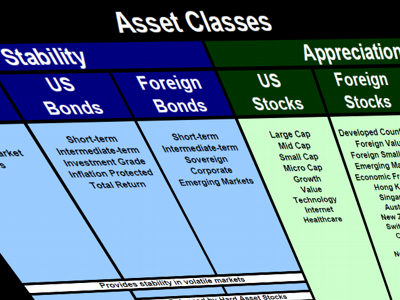
The most basic allocation in your portfolio is between investments that offer a greater chance of appreciation (stocks) and those that provide greater portfolio stability (bonds). These two categories have the largest negative correlation. Thus decisions made at this level are the most important in determining how well behaved your portfolio returns will be.
Not only do these two categories have the largest negative correlation, but they also have very different expected average returns. Stable investments like bonds have an average return of about 3% over inflation. Appreciating assets like stocks have an average return of approximately 6.5% over inflation.
If your portfolio is 100% in stocks, it will have the greatest long-term appreciation, but it will also be the most volatile. Consequently, it may not give you the best chance of meeting your goals. For example, a long-term average return around 10% from U.S. stocks certainly sounds appealing. But they also have a 19% standard deviation. So about six or seven times a century, you will experience a decade of flat or negative returns.
These awful returns happen even more frequently than a Gaussian function (or bell curve) would predict because stock market returns are not well-behaved Gaussian statistics. They behave more like fractal power laws, which in lay terms means the curve has lumpy tails far from the average.
We all know, at least experientially, what a lumpy tail looks and feels like because we just lived through one in 2008. According to Gaussian statistics, you should not experience such terrible years in the U.S. stock market as frequently as you do. Sometimes such events are called “black swans,” or outliers. Sometimes we just say that the markets are inherently volatile.
This wild volatility may threaten the fulfillment of your financial goals. Aiming for a 10% return with wild volatility doesn’t make sense if you only need a 7% return to guarantee meeting your financial goals. So sometimes slightly lowering your expected return can vastly lower your expected volatility. As a result, you increase the odds of exceeding the modest return you need to meet your goals.
Because of the difference in returns between stocks and bonds, they won’t rebalance themselves over time. Left to itself, the allocation to stocks will grow larger and larger until it represents close to 100% of your investments. As this happens your portfolio will also grow more and more volatile and your goals more susceptible to market corrections.
Due to the difference in expected returns and the need to handle withdrawals during retirement, we consider the categories of stability and appreciation to be larger than asset classes. Correlation at this level will not boost returns because stocks normally outperform bonds. But it will definitely protect your investment. Consistent rebalancing by selling stocks and buying bonds helps protect your net worth and consequently your lifestyle. The reverse, selling bonds and buying stocks, is not as necessary and only appropriate for younger investors who are still adding to their portfolio.
Older investors should have at least five to seven years of their safe spending rate allocated to stability. For them, replenishing the allocation to stability during times when stocks are appreciating helps secure future years of spending.
Only younger investors who are still a number of years away from retirement or who have more stability than they need to support their lifestyle can afford to rebalance from stability back into stocks after a market correction. Doing this can help boost returns somewhat, but it has risks if the markets continue to decline. Therefore never shift more than you can put at risk back into uncertain appreciating assets.
All investors should set a limit to their losses and allocate that limit to stability. That limit generally should be five to seven years of safe spending, but it could be eight to 10 years for very conservative investors. If an investor is frugal enough, he or she can afford to be 10 years in stability. Forgoing the chance of appreciating won’t endanger a sufficiently frugal lifestyle.
Using the negative correlation between stocks and bonds properly means trimming stock market gains regularly to keep portfolio risk and volatility under control. This discipline gives you the best chance of supporting your safe withdrawal rates during retirement.
See Also:
- Investment Strategies Part 2: Use Correlation to Define Asset Classes
- Investment Strategies Part 3: Rebalance Regularly Between Asset Classes and Subcategories
- Investment Strategies Part 4: Don’t Rebalance at the Sector Level
- Investment Strategies Part 5: In Defense of Diversification