 Inherently volatile, the average daily fluctuation of the stock market is about 0.76%. If this movement were always up, the market would appreciate to more than six times its value in a year. If all the movement were down, you would have less than 15 cents for every dollar you invested at the beginning of the year.
Most of this fluctuation is like the beating of a hummingbird’s wings–lots of movement but no progress. Every year after matching all the up days and down days, you are left with about seven days that represent the entire year’s investment gain or loss. Thus daily movements are 97% noise and 3% direction.
Volatility, therefore, is a matter of perspective. Are you watching the hummingbird or its wings?
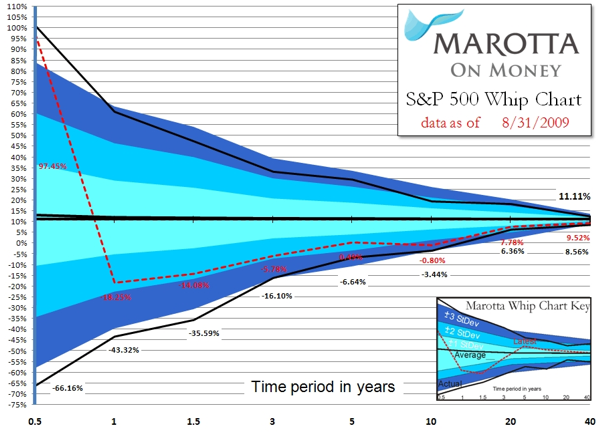
I’ve charted the movement of the S&P 500 total return since 1950 from eight different perspectives in what I call a “whip chart.” Each measure of risk and return is analogous to a different part of the whip.
Out at the very end of the whip is a bit of thread called the cracker, or popper. As all the momentum of the heavier whip flows into this light thread, it curls back on itself. The snapping sound comes from the cracker accelerating beyond the speed of sound, creating a tiny vacuum and sonic boom as the air rushes back in.
We can compare the cracker to the six-month activity in the market. On average the six-month movement is up 6.4%, equivalent to a 13.2% annualized return. For the sake of just measuring speed, we convert all the market movements into how far they would have moved at that speed over a year.
On an annualized basis, six-month returns deviate wildly, about 23.7%. The standard deviation (SD) measures volatility statistically, or how much room it takes for the cracker to snap. Approximately 68% of returns will curl around within 1 SD (±23.7%), 95% will fall within 2 SD (±47.4%) and 99.7% will fall within 3 SD (±71.1%). Stock market returns are by nature capricious and exceed the statistical norms for returns that fall outside of three deviations.
In fact, the past six-month period was more than 3 SD above average, earning 40.5% (97.5% annualized). And the six months preceding that were below 3 SD, losing 41.8% (66.2% annualized). Because six-month returns are compounded, when annualized the positive side multiplies and the negative side is diminished. Therefore the 3 SD isn’t exactly ±71.1%. The 3 SD return is compounded as +89.2% to -55.6%.
Unlikely ups and downs like these are sometimes labeled “black swan” events. Or they may be described by the number of SDs they fall within. For example, because these two recent events are slightly more than 3 SD, they are called “four-sigma” events.
Four-sigma events should occur less than 0.3% if market returns conformed to a Gaussian bell curve, but they do not. The markets are inherently volatile. Market returns are better described by a branch of mathematics known as power laws. Instead of a neat statistical bell curve, these formulas are used to describe fractals where the same patterns can sometimes be wildly larger or smaller than the one you are looking at. Having just experienced two four-sigma events, these are not simply academic musings.
Every time the cracker pops, and the news is talking about how good or bad the markets are doing, should signal you to rebalance your portfolio. Having just finished a four-sigma positive market run, now is an excellent time to take some money off the table. The cracker snapped up, and if you rebalanced at the bottom your asset allocation now tilts more toward stocks. By rebalancing your portfolio you will reset your portfolio to an allocation ready for the next move of the whip.
Annualized returns are slightly better behaved, more like the “fall,” a bit of unbraided leather at the end of the whip. Annual returns within one sigma range from +29.2 to -5.2%. The two-sigma range is +46.4% to -22.4%. And the three-sigma range is +63.6% to -39.5%.
The leather fall attaches to the braided thong with a fall hitch. And a knot called a keeper holds the braided thong to the handle. Just as each of these parts of a whip experience smaller movements, so the SD continues to diminish for returns over a year and a half (fall hitch), 3 years (thong), 5 years (keeper) and 10 years (handle).
The handle of a whip, our 10-year horizon, is much more manageable. The one-sigma range for an annualized 10-year return is +16.2% to +6.33%. The two-sigma range is +21.1% to +1.40%. Not until a three-sigma event can a decade-long return for the S&P 500 turn negative. The three-sigma range is +26.1% to -3.5%. The past 10-year return has been -0.8%
The 10-year return (the handle) swings more than a 20-year return (the arm), which moves more than a 40-year return (the shoulder). Volatility begins to lessen as you move further and further away from the end of the whip. From the perspective of a whipping cracker, volatility is extreme, snapping faster than the speed of sound. But if you are a fly sitting on the shoulder of the person wielding the whip, you haven’t moved.
At every stage of the whip, the average trend is more than 11% positive. Picture the person holding the whip as riding an escalator that is slowly but constantly ascending. Despite the whip cracking up and down, the general trend is upward.
Rebalancing frequently recognizes and takes advantage of the volatility of this trend. Staying invested during market gyrations takes advantage of the escalator.