In the last several columns, I have described the investment science that supports dynamic asset allocation. Think of static asset allocation as where to set your sails and dynamic asset allocation as a way to keep your balance as your boat glides and sometimes bounces through the waves.
A static asset allocation, not the same as a buy-and-hold strategy, already has a dynamic component. Buy and hold sets an asset allocation and then allows the portfolio to drift. The portfolio generally moves in a more aggressive direction, increasingly overweighting whatever has done well. It’s certainly a better strategy than jumping out of the markets after a drop and waiting to jump back in after a rally. But it isn’t the optimum strategy.
Asset allocation is a buy-and-rebalance strategy. Portfolio rebalancing boosts returns. And thanks to a rebalancing bonus, this strategy produces portfolios with either higher returns or lower volatility. By looking at the mean return and standard deviation of an asset class, you can gauge its distance from the efficient frontier. The correlation of an asset class to other asset categories determines the optimum ratios of those two indexes in your portfolio.
We used a ratio of excess return to standard deviation called the Sharpe ratio to measure the efficiency of each asset category. Then we used a proportionally weighted allocation based on the square of each Sharpe ratio to create a portfolio asset allocation. I humbly call this the Marotta allocation method.
Last week we looked at the Shiller price-to-earnings (P/E) ratio. We took the current price and divided by the average inflation-adjusted earnings from the previous 10 years. This measurement is also known as the cyclically adjusted P/E ratio, or the Cape ratio, abbreviated as P/E 10.
The Shiller P/E ratio helps determine the expected forward-looking return of an investment or index, not if you should be in or out of the markets. Another measurement is the forward-looking P/E ratio. It uses projected earnings for the next 12 months.
The projected P/E ratio can help us decide where to invest. If one index’s projected P/E ratio implies it is relatively cheap and another that it is relatively expensive, overweighting the inexpensive index should boost investment returns.
For example, take the projected P/E for the Russell 2000 small cap divided by the projected P/E ratio for the Russell 1000 large cap. This ratio of P/E ratios averages about 1.033. Small cap has a slightly higher P/E ratio because people are willing to pay a little more for a small-cap stock. Although the mean ratio of P/E ratios is close to 1, the standard deviation is 0.122. One standard deviation is a good measurement to use. When the ratio is as high as 1.155, the market is signaling that small cap is relatively expensive and large cap relatively cheap. An allocation tilted more toward large cap should do better. And when the ratio is as low as 0.911, one standard deviation, the market is signaling that small cap is relatively cheap and should outperform in the coming months. Tilting dynamically between asset categories can boost returns even more than asset allocation.
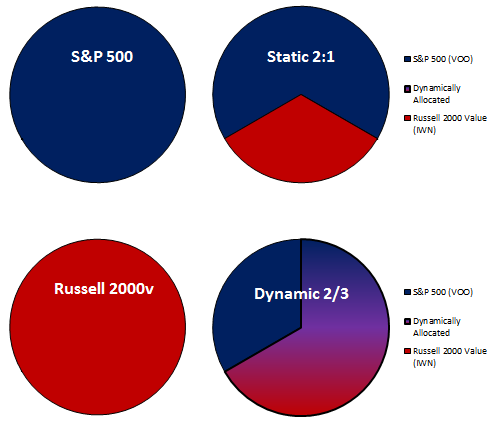
Let’s look at four concrete examples for the U.S. stock allocation of our gone-fishing portfolio. Our first two examples represent the extreme indexes of large-cap and small-cap value. First we put everything in the S&P 500. Then we put everything in the Russell 2000 Value. Our third asset allocation is a static one with two thirds in the S&P 500 and one third in the Russell 2000 Value. Normally an allocation that tilts toward small and value will have higher returns.

The final asset allocation is done dynamically. One third is put into the S&P 500. The remaining two thirds is divided between the S&P 500 and the Russell 2000 Value. Normally the allocation is split evenly. This results in the same allocation as the static asset allocation with two thirds in the S&P 500 and one third in the Russell 2000 Value. This normal allocation occurs when the ratio of the projected P/E ratios is at the mean of 1.033.
But as the ratio of the Russell 2000 projected P/E to the Russell 1000 projected P/E rises, this dynamic allocation will tilt more toward the cheaper large cap. At 1.155, one standard deviation higher, the dynamic allocation will be all toward the S&P 500. And as the ratio drops to 0.911, one standard deviation lower, it will approach the dynamic allocation being entirely in the Russell 2000 Value. Because one third is always in the S&P 500, this results in two thirds in the Russell 2000 Value.
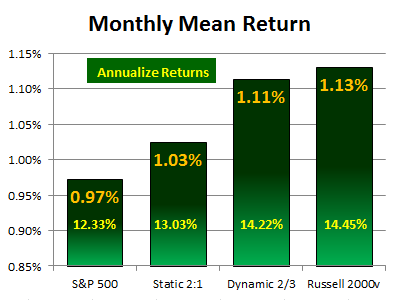
We looked at the mean monthly return and standard deviation of these four portfolios from 1979 through 2011. The S&P 500’s monthly return was 0.97% versus the Russell 2000 Value’s 1.13%. Annualized, that’s the difference between 12.33% and 14.45%.

The Static 2:1 asset allocation boosts returns by approximately the one-third higher returns of the Russell 2000 Value allocation. The only benefit of asset allocation is that this 0.70% annualized higher return (13.03%) could be gained without any additional increase in standard deviation.
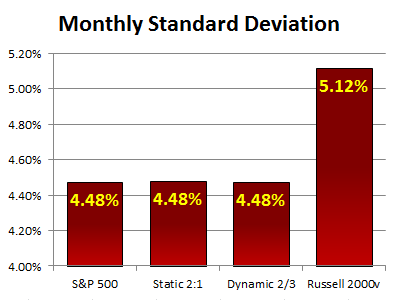
Amazingly, over this time period the dynamic allocation boosts returns another 1.19% over the static allocation, even though the average asset allocation was no different. The dynamic asset allocation has an annualized return of 14.22%, although the monthly standard deviation was no more than the S&P 500.

Boosting annualized returns by static and then dynamic asset allocation 1.89% without adding monthly standard deviation, you can reap the benefit of careful portfolio construction and dynamic changes based on the ratio of projected P/E ratios.

We’ve been using the U.S. stock portion of our portfolio to illustrate how static portfolio construction using the Marotta allocation method gives us a starting target. Then a ratio of projected P/E ratios can be added to offer a dynamic component and boost returns even more. In our typical portfolios, the percentage allocated to a U.S. style box is usually less than a quarter of the total portfolio. But this same methodology can be used with any noncorrelated asset categories to provide a dynamic allocation model.
Subscribe to Marotta On Money and receive free access to a video seminar on: Boosting Returns through Static and Dynamic Asset Allocation.
One Response
David John Marotta
This post was selected for mention in the Financial Simplicity Carnival