“Past performance is no guarantee of future results.”
The Securities and Exchange Commission (SEC) requires that mutual funds tell investors that a fund’s past performance does not necessarily predict future results in their advertising. The remainder of those ads often do nothing except display past performance, Morningstar stars (based on past performance), and beating an index (based on past performance).
The SEC-mandated disclaimer makes it sound like, while past returns are no guarantee of future results, there is some correlation and past returns make similar future results more likely. But this is not the case.
In other words, because the SEC-mandated disclaimer is so weak, it implies that a stronger disclaimer would be false. It makes it sound like there is some correlation between past performance and future results. And it plays into our brains’ assumption that the return of this month or this year will be correlated to what has happened over the past 12 months despite the fact that returns are extremely random.
A 2009 study found that this SEC-mandated disclaimer is completely ineffective at changing investors’ propensity to invest and their expectations regarding the fund’s future returns. Their study found that this stronger disclaimer would have made a difference in investor’s expectations:
Do not expect the fund’s quoted past performance to continue in the future. Studies show that mutual funds that have outperformed their peers in the past generally do not outperform them in the future. Strong past performance is often a matter of chance.
I decided to do a study to see how much correlation there was between this month’s return or this year’s return and the performance for the past 12 months. I used monthly S&P 500 total return data from 12/31/1969 through 11/30/2014.
To be clear, my study is showing how much the momentum of the market’s past performance is correlated to future results. My study is not measuring fund managers, but the principles are similar.
As the measure of “past performance” I used the total return of the S&P 500 for the trailing 12 months.
As the measure of “future results” I used the total return of the S&P 500 for the next month and the next 12 months.
Here is the scatter plot for Next Month’s Return:

The correlation is very close to zero. The markets are inherently volatile. And next month’s market returns have nothing to do with the past 12 month’s return. I put the formula on the trend line to see exactly how much correlation there might be. The formula suggests that for every 10% movement over the past 12 months there might be a 0.049% difference in future returns for the next month. This is so insignificant as to be random. If it shows a slight momentum, it could just as easily have been negative and showed a reversion to the mean.
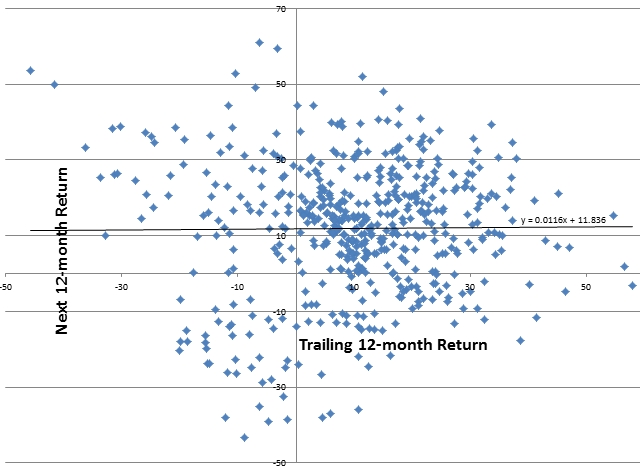
And here is the scatter plot for the Next 12-month Return:

And once again, future returns seem to have little correlation to past performance. The formula for the trend line suggests that for a 10% difference in returns over the past 12 months there might be a 0.116% difference in future returns over the next year.
There is a slight correlation over one month (0.049%). If you annualized that monthly correlation it would be 0.558% for the year. But the coming 12 months only show a correlation of 0.116% showing that whatever momentum there might be doesn’t last very long.
Statistically I don’t think you can make a case for “the momentum of the markets.” And if you did make a case I think you would have to say that it takes a month or two for some people to calm down and their perceptions to change. But you would also have to admit just from looking at the scatter plot that the herd of investors can change very quickly.
As I have said before: the markets are inherently volatile.
Photo used here under Flickr Creative Commons.