Most new investment strategies that offer market-beating returns fizzle out as quickly as they rise to the top. Others have more staying power and more robust data backing them. Low volatility strategies perform well in some but not all back-tested periods, which is a questionable result considering the higher administrative fees for these products.
Low volatility strategies attempt to identify companies with less than average fluctuation. You are not going to find exciting information technology companies like Netflix in a low volatility fund but you will find companies like Procter & Gamble. The manufacturer of Luvs and other necessary family staples is just the kind of company that fits well in a low volatility portfolio.
Low volatility portfolios are sorted by Beta (β) which is a measure of the volatility of security compared to the volatility of entire market. If a security has a Beta of 1.25, it is supposed to be 25% more volatile than the market. On the other hand, a low volatility portfolio will only hold stocks that have a Beta below 1.

Some proponents argue that low volatility portfolios are underappreciated because they stay off the headlines of the financial news. From 1970 onward, low volatility strategies have offered higher returns and lower volatility than the index, which leaves some investors asking why anyone would invest in high Beta stocks.
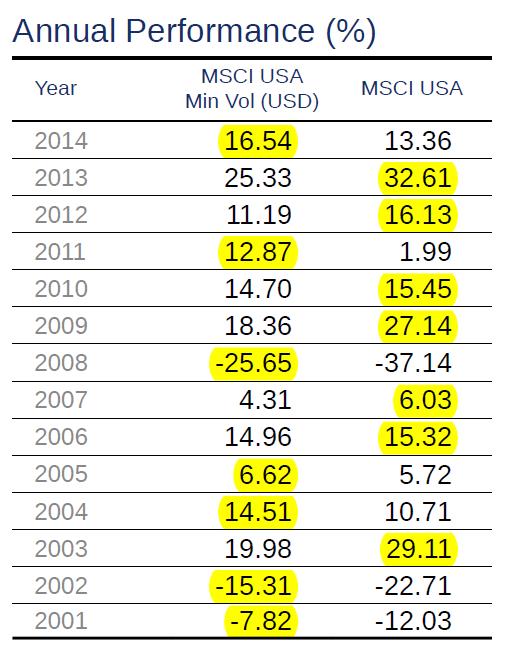
But the out-performance of low volatility is far from consistent. When comparing the MSCI USA Minimum Volatility index with the MSCI USA index, low volatility has outperformed in only half of the last fourteen years since the inception of the Index.
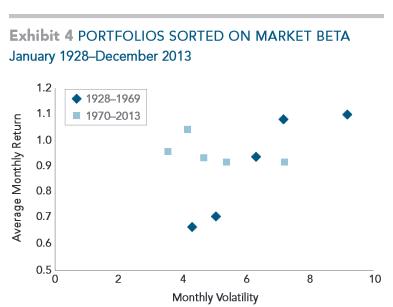
This marginal superiority of a low volatility strategy breaks down when you analyze the pre-1970 data. A study performed by Dimensional Fund Advisors shows that before 1970, lower volatility is associated with lower returns, which is what we would expect to see. The dark blue dots (pre-1970) show that volatility and reward are correlated which is in contrast to the 1970-2013 data.

If you are going to try to beat the index, you need to find factors that are consistent across time and across markets. Eugene Fama, father of the Fama-French factor model, suggests that it takes 67 years’ worth of data points to even begin to feel confident that back-testing results are reasonable.
The other problem with this strategy is the additional costs associated with implementation. If you want to implement the low volatility strategy on an international portfolio, the iShares MSCI EAFE Minimum Volatility ETF (EFAV) is one of your most cost effective options. This comes with an expense ratio of 0.20% which includes a fee waiver of 0.14% which is good through November 30, 2015. Once this fee waiver expires, the total expense ratio for this position is expected to be 0.34%. Compare this with a very similar substitute fund — the Vanguard FTSE Developed Markets ETF (VEA) which has a mere 0.09% expense ratio.
Additionally, the low volatility funds reconfigure their portfolios every year which means that some stocks will be dropped and others added. In the process, the fund will have to realize gains which are another tax on investor returns. More stable index strategies do not have to buy and sell regularly and enjoy greater tax efficiency.
The Dimensional study finds that low volatility strategies are correlated to value strategies which have a long history of robust outperformance. From 1970-2013, 28% of the low volatility index overlapped with this value factor. With lower fees and a stronger track record, we prefer value strategies over low volatility strategies for our clients.
There are three rules that we follow when looking for an investment strategy that will add value. They must be sensible— which is why we don’t invest based on the Superbowl indicator even though it has a golden track record . The strategy must offer persistent results across time periods and investment sectors. Lastly, the implementation of the strategy must be cost effective. The low volatility strategy fails these last two rules which is why we avoid it.
Photo used here under Flickr Creative Commons.