 Earlier this year I wrote the article, “Does An Inverted Yield Curve Mean I Should Get Out Of The Markets?” in which I made these important points:
- Any indicator which can be manipulated by the government should not be used as a measure of current reality, let alone a future prediction.
- A dip in the yield curve does not cause or necessarily predict a recession.
- Recessions occur, on average, every 5.6 years. Historically, jumping out of the markets every 5.6 years would have been a disastrous investment strategy.
- An inverted yield curve represents the market expectation that these higher short-term rates won’t hold.
Expanding on this last point I wrote:
If it could talk, an inverted yield curve would explain, “Sure you can get 2.26% for the next 3 months, but in a year or two these rates are going to be back down at 1.34%. If you want 2.05% for the long term you should buy 10-year Treasuries. That’s the best you can get for the long term.”
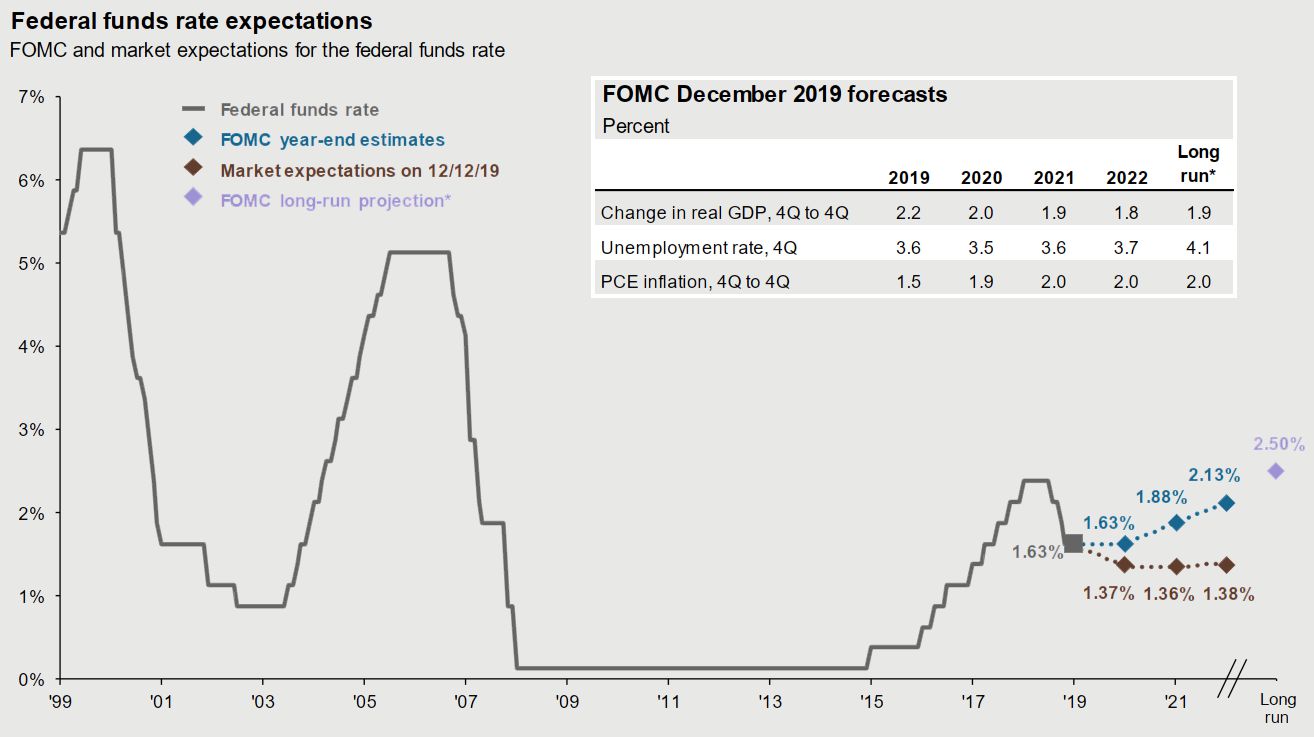
The market was suggesting that the 3-month rate might drop as low as 1.36%. It was most certainly suggesting that it would drop below the 2.05% that was being offered for 10-year Treasuries. Now, six months later, the 3-month rate has dropped to 1.63%, and the market thinks it may drop even slightly lower.
Now six months later, here is the end of year chart from J.P. Morgan’s quarterly Guide to the Markets showing the FOMC’s lowering of the federal funds target rate (the dip at the end of the grey line) and the market expectations of a lower rate still (the maroon line).
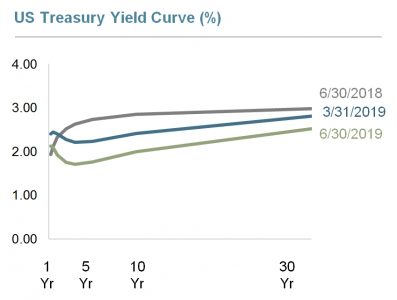
Dimensional Funds offers a nice quarterly market review. We use many of their slides in our quarterly mailing. Here is an image from one of the slides that we used in our last article about yield curves where you can see that the 6/30/2019 curve is inverted, bowing downward such that short-term interest rates are higher than the 10-year rate.
The little downturn at the beginning of the green-grey 6/30/2019 line was the inverted yield. The first part of the line, the 1-year rate, was higher than the following 5-year rate.
At this time the Federal Reserve had raised the Federal Funds Rate from the 0.50% at the end of President Obama’s term to 2.5%.
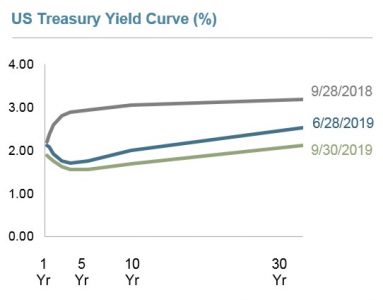
Here is that same graph from the next quarter showing that the 9/30/2019 curve is less inverted.
You can see that the first part of the line, the 1-year rate, is still slightly higher than the following 5-year rate.
On July 31, 2019 the Federal Reserve lowered the Federal Funds Rate to 2.25%. Then they lowered it to 2.0% on September 18th, and again to 1.75% on October 30th.
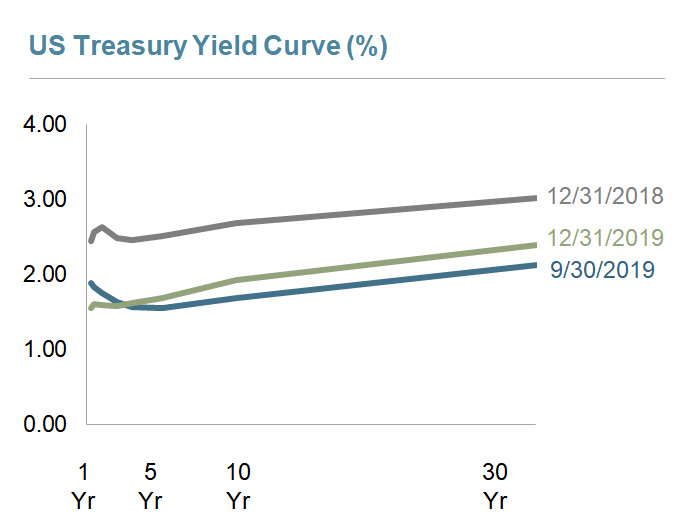
And now at the end of 2019 the 12/31/2019 graph looks like this:

You can see that it is no longer inverted. The 12/31/2019 grey-green line starts low and progresses upward. The longer term rates pay a higher yield than the shorter term rates.
Just as the inverted yield curve was not a guarantee that we would have a recession, so too an uninverted yield curve isn’t a guarantee that we won’t have a recession.
Recessions are difficult to predict. A recession is officially defined as when the Gross Domestic Product (GDP) growth is negative for two or more consecutive quarters. Sometimes a recession is only recognized in retrospect. Recessions are common in the United States. Therefore predictions that hedge the date of a coming recession by putting it a few years in the future are very likely to be technically correct because of the random arrival rate of a recession. Between 1929 and 2008, the United States had 14 recessions, which is a recession every 5.6 years. Even if you could have anticipated every recession, jumping out of the markets every 5.6 years would have been a disastrous investment strategy.
Missing out on the S&P 500’s 31.49% return for 2019 is just as bad as experiencing the equivalent drop in the markets. Investors hurt their finances more by missing out than they do by staying in.
As always, we recommend that investors remain calm and rebalance. Rebalancing is nearly always a better solution than panicking.
Photo by Carolyn on Unsplash


