Crafting portfolio asset allocations is a combination of art and engineering. Just as a blending of colors can produce cerulean, so a blending of indexes produces a unique shade of risk and return. And these blended portfolios can be better than any of their components.
Many investors don’t appreciate asset allocation or understand intuitively how a diversified portfolio can exceed the sum of its parts. After all, the capital asset pricing model (CAPM) suggests that return follows risk, and therefore you can’t increase return and reduce risk at the same time. But CAPM is just a straight-line projection. And at the efficient frontier, the math produces nothing but curves.
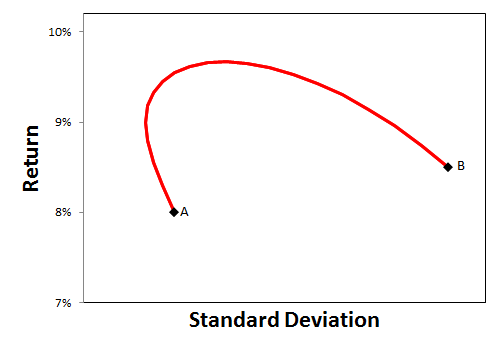
The efficiency of an investment is measured by the greatest return for the lowest volatility. Blending a portfolio allocation can make it even more efficient by either boosting returns or lowering volatility.
To understand the math behind blended returns, let’s start with a simple case of two investment choices and two years. Investment A goes up 30% the first year and 0% the second year. Investment B goes up 0% the first year and 30% the second year. If you invest in either A or B, you get a 30% return over two years. Your average volatility is 15%.
It seems no matter how you mix these two investments, you can’t get more than a 30% return over two years. But you can. And you can lower your volatility as well.
Imagine a blended portfolio of half invested in A and half invested in B. The first year you would experience a 15% return, and the second year a 15% return. Your volatility would be 0%. Lower volatility means a more efficient portfolio.
You would have both lower volatility and higher returns. Compounding returns would produce a total return over the two years of 32.25%. You experience a higher return because after half of your portfolio invested in A grows by 30% the first year, you rebalance your portfolio. So half of the growth from investment A is rebalanced and put into investment B. Half the growth would experience another 30% growth the second year when investment B did better. Thus your total return for the two years would be 32.25%.
Most investors are surprised that by creating a blended portfolio and rebalancing regularly, you can both lower volatility and boost returns. But this is the math behind modern portfolio theory (MPT) developed in the 1950s by Harry Markowitz.
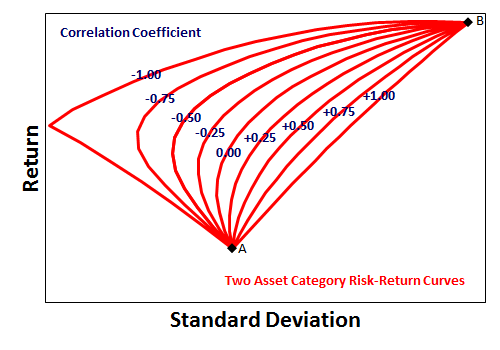
MTP requires knowing the average return and standard deviation of returns for each investment component. This situates each component on the risk-return grid. To look at the effects of blending these two investments together, MPT also entails knowing how much they move in sync with one another. This measurement is called the correlation coefficient. Two asset categories that move completely together have a correlation of +1.0. If they move completely opposite, their correlation is -1.0.
The lower the correlation, the greater the benefit of blending two different indexes in a portfolio. Asset allocation means dividing your portfolio into components that do not move completely in sync with one another to reduce total portfolio volatility. There is also a rebalancing that is a function of low correlation and high volatility.

We use historical correlation measurements to help define what qualifies as an asset class and what is simply a sector or subsector. If historical correlations are low enough, we separate two indexes into different asset classes. Otherwise they are just sectors or subsectors within an asset class.
Once you know the average return, the standard deviation of each index and the correlation coefficient between each pair of indexes, the rest is math. The difficulty is that these measurements vary every year and every decade. Long-term averages are useful guidelines, but there are no guarantees.
If long-term measurements put an index just off the efficient frontier, it should not be eliminated entirely. We consider an investment close to the efficient frontier equivalent to one that historically was clearly there. Perhaps the next decade will be its turn to shine.
Most of the time portfolio gains from rebalancing are small at about 1.6% annually. But there are historical periods, especially choppy volatility ones, when the rebalancing bonus is significant enough to bend the mix of a blended portfolio well above either component by itself.

Placing asset categories on the efficient frontier requires knowing their historical average return and standard deviation. These numbers vary depending on the period of time being measured. If you measure risk and return during a time period in which one asset category did poorly, that category will not appear on the efficient frontier. However, if it happened to do well with little volatility during the time measured, it might dominate portfolio construction.
The math is only as good as the assumptions. And the assumptions can only be measured exactly by looking backward at historical returns. But past performance is no guarantee of future returns, which is why portfolio construction is part engineering and part art. There are assumptions to be made. Engineering can suggest elegant answers or art can be crafted with engineering precision, but nothing is guaranteed.
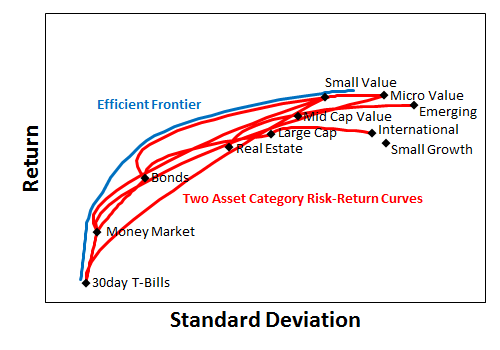
Last week we looked at several asset categories and placed them on the risk-return chart. Blending these asset categories produces bowed lines between them showing more efficient portfolios. The curves for two components are relatively easy. The computations for multiple investment components become more complex.
The efficient frontier is the blending of all possible components into portfolios with the highest possible return and the lowest possible volatility. Diversification means you always have something to complain about. But it also allows investors to craft allocations that are along the efficient frontier, getting the most return for the least volatility.

2 Responses
vern
Hi David
How does the cost of rebalancing play into this ? Trades cost money .
That seems to be the only downside I can see .
Capturing some of profits seems to be a good idea since the market is cyclical .
Thanks Vern
David John Marotta
The Yale Foundation measured their rebalancing bonus at 1.6% annually. Rebalancing trades cost less than $10 and the spread on popular exchange traded funds is also very small. Consequently the costs of rebalancing are extremely small compared to the gains.