 I publish a “Freedom Investing in Review” series which provides a transparent performance reporting of our Freedom Investing model portfolio. Sometimes Freedom Investing is the darling, but recently it has been the dog.
In “Freedom Investing in Review (December 2024),” I reported how we saw that in 1-year returns ending December 31, 2024, Developed Freedom Investing had a -3.37% disadvantage. It begs the question: Why are we invested in a strategy which posted such underperformance in 2024?
While this performance is disappointing, it is actually normal based on the same data that convinced us of Freedom Investing in the first place.
In 2020, I did a 25-year backtest of our Freedom Investing strategy and published those results in “A 25-Year Review of Freedom Investing” and “Risk-Return Analysis of Freedom Investing.”
In that backtest, we saw that even though on average Freedom Investing has a 1-year advantage of +2.093%, 5-year advantage of +1.995%, 7-year advantage of +2.314%, 10-year advantage of +2.400%, 15-year advantage of +2.392%, and 20-year advantage of +2.073% over the EAFE Index, there still exist several 1-year, 5-year, or 7-year time periods where the EAFE Index beats Freedom Investing.
Of the 293 measured 1-year periods, Freedom Investing lost to the EAFE Index in 96 of them, which is 32.765%. This means that even though the data suggests that Freedom can outperform developed markets in the long run, one third of the time we would expect Freedom Investing to underperform.
This volatility can be seen on the “Advantage of Freedom Investing’s Rolling Return by End Date, 1-Year Rolling Return Advantage” graph from my original analysis:
The fact that a strategy can routinely underperform by -6% while still having an average out performance of +2% is a perfect representation of the inherent volatility of the markets.
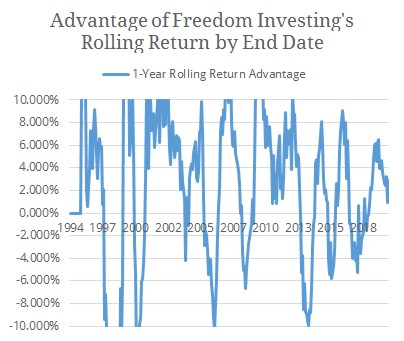
Each trough on that graph represents a time period when Freedom Investing underperformed. In fact, I reopened my analysis for this piece and approximately 58% of the times when Freedom Investing underperformed in 1-year rolling time periods, it did so by more than 4%. What is more, the average underperformance for the years when Freedom Investing under performed was -6.37%.
The fact that a strategy can routinely underperform by -6% while still having an average out performance of +2% is a perfect representation of the inherent volatility of the markets.
This is why in “How Long Should I Give An Investment Plan?” the main question is: “Do you have sufficient data to justify the long term mean returns you want?” If you do, give it more time.
For the most part, short term returns should not ruin a brilliant long-term investment strategy. Normally it is best to rebalance your portfolio selling what has gone up and buying what has gone down. If you can’t stomach rebalancing your portfolio, at least don’t lose heart and abandon the plan.
Photo of South Korea by rawkkim on Unsplash. Image has been cropped.
Latest posts from Megan Russell
- Freedom Investing’s Returns Have Been Disappointing But Normal - February 4, 2025
- #TBT How Long Should I Give An Investment Plan? - January 30, 2025
- Freedom Investing in Review (December 2024) - January 28, 2025