Throughout 2012, nervous investors did not have to look hard for reasons to avoid the financial markets. The daily headlines provided abundant gloom to feed their doubts, but investors who acted on impulse could have missed a potential opportunity to participate in strong returns across the global financial markets.
The year opened with lingering concern about the weak US recovery, the debt crisis in Europe, and political uncertainty around the world. Many financial pundits had predicted another lackluster year for stocks and more market volatility. Some predicted a euro zone breakup triggered by impending debt defaults in Greece and Portugal. The global economy was showing early signs of a slowdown, and many investors were weighing the potential economic impact of the US elections and so-called “fiscal cliff.”
Despite a steady diet of bad news, most markets around the world climbed the proverbial “wall of worry” to log strong returns. Major market indices around the globe delivered double-digit total returns, and as a group, the non-US developed and emerging markets outperformed the US equity market. The total market value of global equities, as measured by the MSCI All-Country World Index, increased by an estimated $6.5 trillion in 2012, while market-wide volatility fell to its lowest level in six years.

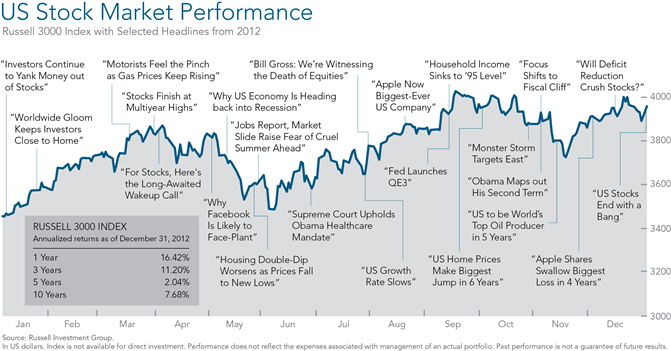
The above graph highlights some of the year’s prominent headlines in context of broad US market performance, as measured by the Russell 3000 Index. These headlines are not offered to explain market returns. Instead, they serve as a reminder that investors should view daily news events from a longer-term perspective, and avoid making investment decisions based solely on the news.
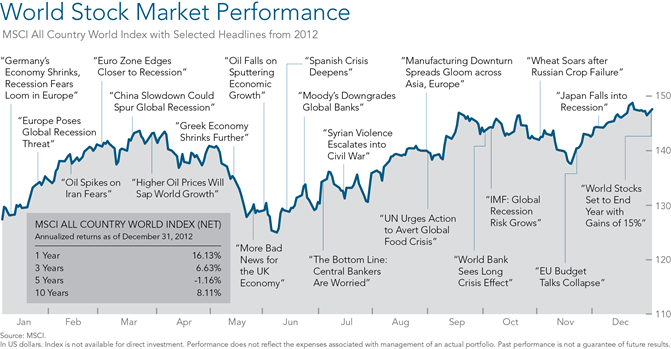
The world stock market performance chart below offers a snapshot of global stock market performance, as measured by the MSCI All Country World Index. The global headlines show that despite an abundance of negative news during the year, global stocks had an exceptional year.

Economic Backdrop
Sluggish US Recovery
The current expansion, which started in mid-2009, has been deemed the weakest in postwar history. In past cycles, strong recessions were followed by strong recoveries. But the current rebound has produced economic growth of just 2.4%, compared with a 3.4% postwar average. In 2012, investors watched eagerly for signs that the US recovery was gaining steam. The weak economy was the central focus in the presidential election, and the debate raged over what combination of fiscal, tax, and regulatory policies would lead to higher growth and job gains.
Overall, there was continued weakness in job growth, real wages, consumer confidence, and spending. Positive news also surfaced throughout the year, including healthy corporate earnings and strong balance sheets, continued low inflation, falling oil prices, historically low mortgage rates, a strengthening housing market, and upticks in auto sales and manufacturing activity late in the year.
Continued European Debt Troubles
The euro zone continued its struggle to contain the sovereign debt problems of several member nations, including Spain, Italy, and Greece. The inability of these governments to pay interest on their debt has impacted the banks in stronger European countries, notably France and Germany, which have large exposure to the sovereign bonds. The European recession prompted banks that are holding the troubled assets to reduce lending, which contributed to lower growth across the region.
During 2012, the euro finance ministers agreed on a second bailout package for Greece, which included a 53% write-down for investors in Greek bonds. In May, concern grew over Spain’s fiscal health when a major bank requested a massive bailout and disclosed troubled assets. Following the Greek election in June, the European central bank pledged to provide monetary support to protect the euro, triggering a rally in stocks and bonds.
Rising Global Economic Worries
According to International Monetary Fund estimates, the global economy grew 3.3% in 2012—down from 3.8% in 2011 and 5.1% in 2010. There was concern that the worsening euro debt crisis would spread to other economies and markets. Europe accounts for a large portion of global demand, especially for export-dependent China. Germany’s economy is the fourth largest in the world, followed closely by France. Together, the combined economies of all 17 euro-area countries are nearly equal to that of the US, in GDP terms.
During the first half of 2012, China’s economy showed signs of weakening, with growth expected to fall to around 8%—a significant drop from its historical growth rate. China exports heavily to the euro zone. The crisis also threatened to reduce China’s exports to poorer emerging economies in Africa and Latin America, where nations rely heavily on European banks for trade financing. In the latter part of 2012, concerns over slowing growth in emerging markets had begun to ease as economies appeared to bottom out.
Stabilizing Actions by Central Banks
Many investors did not appear to anticipate the degree to which markets would positively respond to central bank actions. Many analysts credit the US and European central banks with boosting investor confidence in both markets, and in the case of the European Union, helping avert a euro breakup. The injection of liquidity into the respective economies also helped mute volatility between currencies. In September and October, the Bank of Japan announced measures to provide monetary stimulus through 2013 in response to slowing economic activity.
A Search for Higher Yield
Interest rates dropped slightly to near-record lows during the year. The rate move drove up bond market prices and total returns. But with the Fed and other central banks committing to keeping the financial markets liquid for an indefinite period, some investors found appeal in riskier fixed income securities, such as junk bonds, emerging market debt, and collateralized loan obligations that offer higher yields.
Wall Street responded to rising demand with new offerings. Junk bond issuance hit a record $350 billion in 2012, with many of the issues carrying fewer protections for bondholders. Investors also flocked to high-yielding alternative investments, such as energy partnerships and venture capital funds. Observers warned that the combination of unchecked risk appetites, low interest rates, and high bond prices may present danger for investors who are pursuing yield in markets they do not understand.
2012 Investment Overview 
Highlights
After a flat 2011, the US stock market posted a strong first quarter as the US economy showed signs of improvement and perceptions of the European debt crisis improved. The S&P 500 had its best first-quarter rally in 14 years, closing near a four-year high and a 12.6% total return. When the second quarter began, markets retreated as Europe’s debt crisis returned to center stage and signs of slowing global growth emerged—especially in China, where lower world demand had begun to affect exports.
By June, US stocks had surrendered all of the year’s gains as markets weighed how credit problems in Spain and the anticipated Greek elections would affect the euro zone’s sovereign debt problems. The US economy showed more signs of weakness. Stock markets around the globe stumbled in the second quarter, with non-US stocks suffering the most. During the summer, the markets improved, as European tensions eased on increased European Central Bank loans to Spain and Italy. There was also rising speculation that the Federal Reserve was prepared to deliver additional monetary stimulus to the US economy. Throughout the summer, analysts reduced their estimates of expected corporate earnings growth as an economic slowdown threatened to reduce profits.
In September, the Fed announced its third round of quantitative easing to push long-term interest rates lower and encourage more borrowing and investment. The Bank of Japan also announced an ambitious plan to stimulate its economy. These central bank actions helped drive the markets during the third quarter. The S&P 500 surged 14% from its June 1 low and reached a five-year high on September 14. US economic indicators sent mixed signals, but the economy reportedly expanded at a 3.1% rate for the quarter—the fastest pace since late 2011. Mortgage rates reached historical lows, and year-over-year home prices rose for the first time since the 2007 financial crisis. Heightened inflation fears led to a modest decline in Treasury prices, while gold and most other commodities rallied.
In the fourth quarter, investor attention turned to the close US election and the prospect of gaining certainty regarding future government spending, taxes, growth policy, and regulation. Stocks fell in the weeks following the election as investors gauged the prospects of continued political gridlock and the economic impact of spending cuts and tax hikes, known as the “fiscal cliff.” The S&P recovered its earlier losses by late December, however, and as the year ended, lawmakers scrambled to reach a compromise.
Market Summary
All major US market indices were up substantially for 2012. The S&P 500 gained 13.4%, and with dividends included, logged a total return of 16%. The NASDAQ Composite Index gained 15.9% for the year, and the Russell 2000, a popular benchmark for small company US stocks, returned 16.3%. The Dow Jones Industrial Average gained 7.3%. The market’s strong performance came with lower volatility, as gauged by the CBOE Volatility Index, which had its largest annual decrease since 2009.
 Non-US developed market indices performed even better. The MSCI World ex USA Index, a benchmark for large cap stocks in developed markets outside the US, returned 16.4%. The MSCI Emerging Markets Index returned 18.2%.
Most country market returns were positive, although the dispersion of returns was broad. Among the 45 equity markets tracked by MSCI, only three—Chile (-0.1%), Israel (-6.2%), and Morocco (-12.6%)—posted negative total returns (gross dividends) in their local currency. Turkey, Egypt, and Belgium were the top three performers, with returns of 55.8%, 54.6%, and 38.5%, respectively. Greece (4.1%), Portugal (3.3%), Spain (3.1%), and the Czech Republic (0.2%) had the lowest positive total returns (gross dividends; local currency).
The currency markets were relatively stable for the year due to the offsetting effect of US, European, and Japanese central banks. The US dollar lost ground against the euro and many emerging market currencies, which boosted equity returns for US investors. The dollar gained against the yen as a result of Bank of Japan’s monetary easing.
Small cap and large cap stocks had similar performance in the US, but small cap substantially outperformed large cap in both the non-US developed and emerging markets. Along the price dimension, value stocks outperformed growth stocks in the US and non-US developed markets, while slightly underperforming growth in emerging markets.
In the fixed income arena, US TIPS performed exceptionally well, returning 6.9%, and short-term government bonds returned 2.1%. Investors seeking a safe haven from global market uncertainty poured money into US Treasury securities, which pushed down yields.
Real estate securities in the US also had a strong 2012, returning 17.1%. Global real estate had a banner year, with a total return of 31.9%, which was the highest-ranked return of major world asset classes. Commodities were the only group to show negative returns for the year, at -1.06%. The decline was their second annual drop, which had not occurred since the late 1990s.
Russell data copyright © Russell Investment Group 1995-2013, all rights reserved. Dow Jones data provided by Dow Jones Indexes. MSCI data copyright MSCI 2013, all rights reserved. S&P data provided by Standard & Poor’s Index Services Group. The BofA Merrill Lynch Indices are used with permission; copyright 2013 Merrill Lynch, Pierce, Fenner & Smith Inc.; all rights reserved. Citigroup bond indices copyright 2013 by Citigroup. Barclays data provided by Barclays Bank PLC. Indices are not available for direct investment; their performance does not reflect the expenses associated with the management of an actual portfolio.
Past performance is no guarantee of future results. This information is provided for educational purposes only and should not be considered investment advice or a solicitation to buy or sell securities.
Information gathered from Dimensional Fund Advisors LP. Dimensional Fund Advisors LP is an investment advisor registered with the Securities and Exchange Commission.