A Bear Market is defined as an index dropping at least 20% from some previous high. Since 1950, there have been exactly nine Bear Markets in the S&P 500 Price Index (the most common representation of “the market”). Only one of these dropped over 50%, turning into a stock market crash. Although you might think that Bear Markets are uncommon, the S&P 500 Price Index spends 18.19% of the time with losses of 20% or greater from some previous high.
Examining past Bear Markets can help provide some context when we experience the next one.
Baby Bear: The Bear Market of 1966
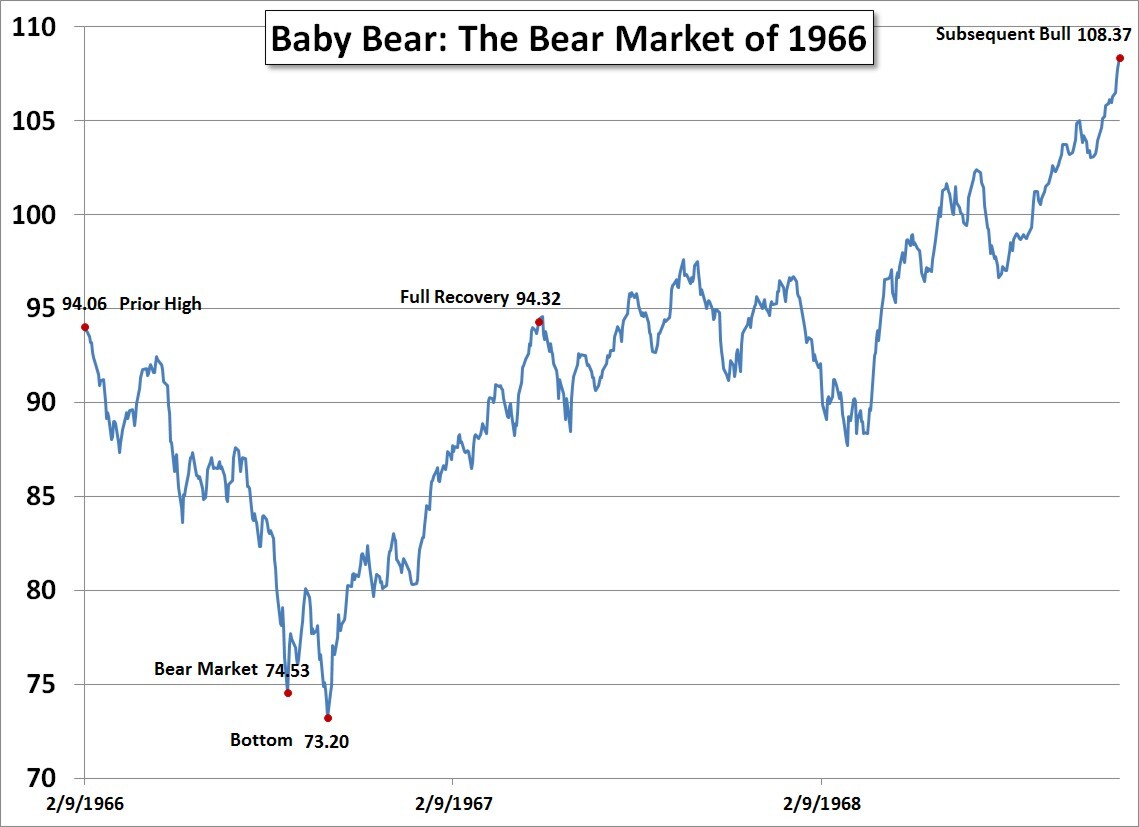
On 8/29/1966, the S&P 500 Price Index dropped to 74.53, down -20.76% from its prior high on 2/9/1966. The market had been dropping for 201 days (6.7 months). It bottomed 39 days later on 10/7/1966 at 73.20, down -22.18%.
Over the next 39 days (1.3 months), the S&P 500 Price Index rose and then dropped below the -20% mark once more.
After bottoming, the market fully recovered just 209 days (7.0 months) later on 5/4/1967.
The entire cycle lasted 449 days (1.2 years), 240 days from prior peak to the bottom and 209 days back to the prior peak. After recovering, the market continued its upward trend for an additional 19 months (1.6 years).
The total 26 month (2.1 years) Bull Market ultimately peaked on 11/29/1968 at 108.37, up 48.05% from the bottom of the Bear Market. During the total recovery from the bottom, the markets experienced an annualized return of 20.06%.

This was the smallest Bear Market since 1950, earning itself the title of “Baby” Bear.
Although most full recoveries take about twice as long as they spent dropping, this Bear Market recovered more quickly than usual. It also had the shortest entire cycle of just 1.2 years.
Here are four important lessons from this baby bear:
1. You only needed a couple of years of safe spending in bonds. Having the appropriate bond allocation in retirement to weather a Bear Market is priceless.
2. You can never tell when the market will stop dropping. Sometimes they stop short, just barely qualifying as a Bear Market. Other times, they are only down between -10% and -20% which is called a “correction.”
3. It is difficult even to identify the cause of Bear Markets. Some historical narratives suggest that the Federal Reserve’s tightening of the money supply caused financial institutions to be less profitable. Others blame the municipal bond market’s credit crunch. At the time, just after the first drop, the Time Magazine of March 4, 1966 suggested:
[Stock] Prices are low because worries are high, and investors are reacting—probably overreacting—to the economic implications of the Viet Nam war. They are afraid of higher taxes and more controls on the economy, perplexed by the squeeze on credit and pressure on profit margins.
During the year of 1966 there were certainly a number of troubles in the world which could have been blamed for the market drop. Bear Markets have thousands of causes as each individual investor decides why they want to sell stock.
4. Drops in the market are buying opportunities. Purchases near the bottom received an annualized return of 20.06% for the next 2.1 years. Rebalancing your portfolio buys just the right amount.
Each Bear Market has its own unique statistics. This Baby Bear was small and quick in its drop, but also small and quick in its recovery. Investors during this cycle gained 15.2% in price, not including dividends. Bear Markets are unpredictable, but this one should not have been a cause of distress.
Photo used here under Flickr Creative Commons.