 A Bear Market is defined as an index dropping at least 20% from some previous high. Smaller drops in the market between 10% and 20% are called “corrections.” Larger drops of at least 50% are called a “crash.”
Since 1950, there have been exactly nine Bear Markets in the S&P 500 Price Index (the most common representation of “the market”). Only one of these turned into a stock market crash. The other eight stopped dropping before the loss from peak to bottom was greater than 50%.
Although you might think that only nine Bear Markets over 65 years makes its occurrence uncommon, each bear market lasts about 3.3 years from peak to bottom and back to full recovery. In fact, the S&P 500 spends 18.19% of the time with losses of 20% or greater from some previous high. That means that, on average, 66 days of each year the S&P 500 Price index is down more than 20% from some previous high.
Examining past Bear Markets can help provide some context when we experience the next one.
Black Monday Bear: The Bear Market of 1987
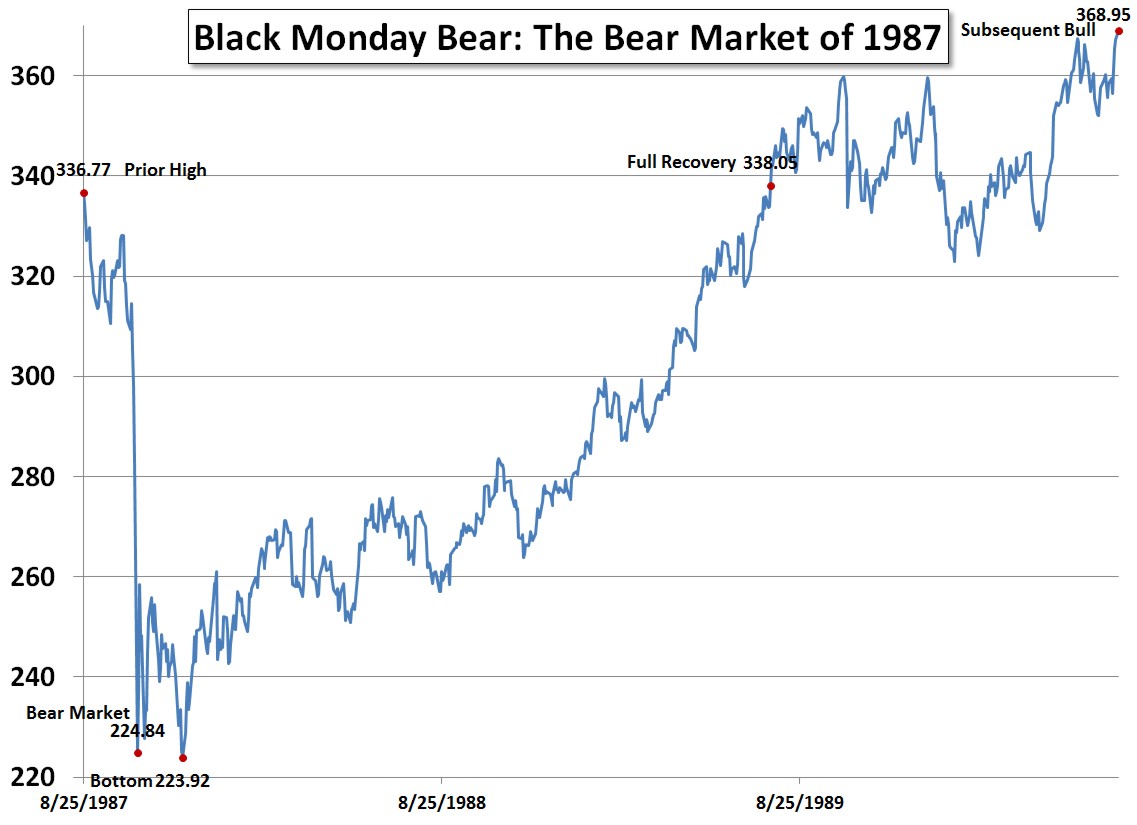
On October 19, 1987 the S&P 500 Price Index dropped to 224.84, down -33.24% from its prior high on August 25, 1987. Most Bear Markets are precipitous, but none as precipitous as Black Monday. That day the S&P 500 dropped -20.47% and the Dow dropped -22.61%. The S&P 500 had only been dropping for 55 days (1.8 months) since August 25, 1987. It was down -16.06% from that previous high.
Black Monday began the week before. On Thursday, October 15, 1987, Iran fired a Silkworm missile at an American owned tanker flying a Liberian flag. As the New York Times reported , “The Regan administration ruled out a response because the ship was not flying the American flag and was not in international waters.”
The next day Iran hit another ship, this one a Kuwaiti ship flying under the protection of the United States flag.
On Friday the S&P 500 dropped -5.16% and the Dow fell 4.6%. London Markets were closed as the Great Storm of 1987 caused hurricane winds throughout the English Channel area. The precipitous drop began on Monday in the Hong Kong markets and spread west as markets opened in Australia, Europe, and finally the United States. Later that morning, U.S. warships destroyed two Iranian oil platforms in what President Ronald Reagan called “an appropriate and proportionate response.”
It bottomed 46 days later on December 4, 1987 at 223.92, down -33.51%.
Despite that precipitous drop, the S&P 500 Price Index ended 1987 up 2.03% and the S&P 500 Total Return Index up 5.25%.
Over the next 546 days (1.5 years) the S&P 500 Price Index rose above and dropped below the -20% mark 13 additional times.
During that time tensions between Iran and the United States escalated after the USS Samuel B. Roberts struck a mine on April14, 1988. Four days later the US began Operation Praying Mantis, the largest U.S. navel engagement since the Second World War. In the end the United States destroyed about half of Iran’s fleet.
Although the markets fell during the worries of war with Iran, the markets were recovering during the actual engagement with Iran.
After bottoming, the market fully recovered to its prior peak just 600 days (1.6 years) later on July 26, 1989. The entire cycle lasted 701 days (1.9 years), 101 days from prior peak to the bottom and 600 days back to the prior peak. After the recovery, the market continued its upward trend for an additional 11.8 months.
Many look back and think of these years as years of peace and prosperity unlike our current situation of uncertainty. This is not the case. The future is always fraught with uncertainty. When you are living through history, it is tumultuous.
During the recovery the world experienced the Intifada, The Afgan War, the Black Sea Bumping Incident, the Iran-Contra Affair, the hijacking of Kuwait Airways Flight 422, Operation Praying Mantis, Microsoft Windows 2.1, the Singing Revolution, the U.S. shooting down Iran Air Flight 655, the Syringe Tide, the formation of Al-Qaeda by Osama bin Laden, the resumption of Space Shuttle flights, the first Internet worm, George H. Bush‘s election to President, the Lockerbie bombing, the plan of what would become the World Wide Web, the Solidarity Movement, Salman Rushdie’s Satanic Verses, food riots in Argentina, the Tiananmen Square massacre, the savings and loan bailout, the Sega Genesis, Voyager 2 passing Neptune, Hurricane Hugo, a Friday the 13th mini-crash, the Loma Prieta earthquake, the fall of the Berlin Wall, the United States invasion of Panama, plans for Germany Reunification, the formation of the Electronic Frontier Foundation, and the Hubble Space Telescope.
Investors are often hesitant to stay in the markets after a precipitous drop. They are even more reluctant to rebalance, selling some bonds and buying more stocks. In this Bear Market, the bottom came six an a half weeks after the Bear Market began and the recovery was quick and steady. Those who got out of the markets and then hesitated missed a significant rally. Those who rebalanced boosted their returns.
During the recovery from the bottom, the markets experienced an annualized return of 21.04%.
The total 32 month (2.6 years) bull market ultimately peaked on July 16, 1990 at 368.95, up 64.77% from the bottom of the bear market.
Photo used under Flickr Creative Commons
