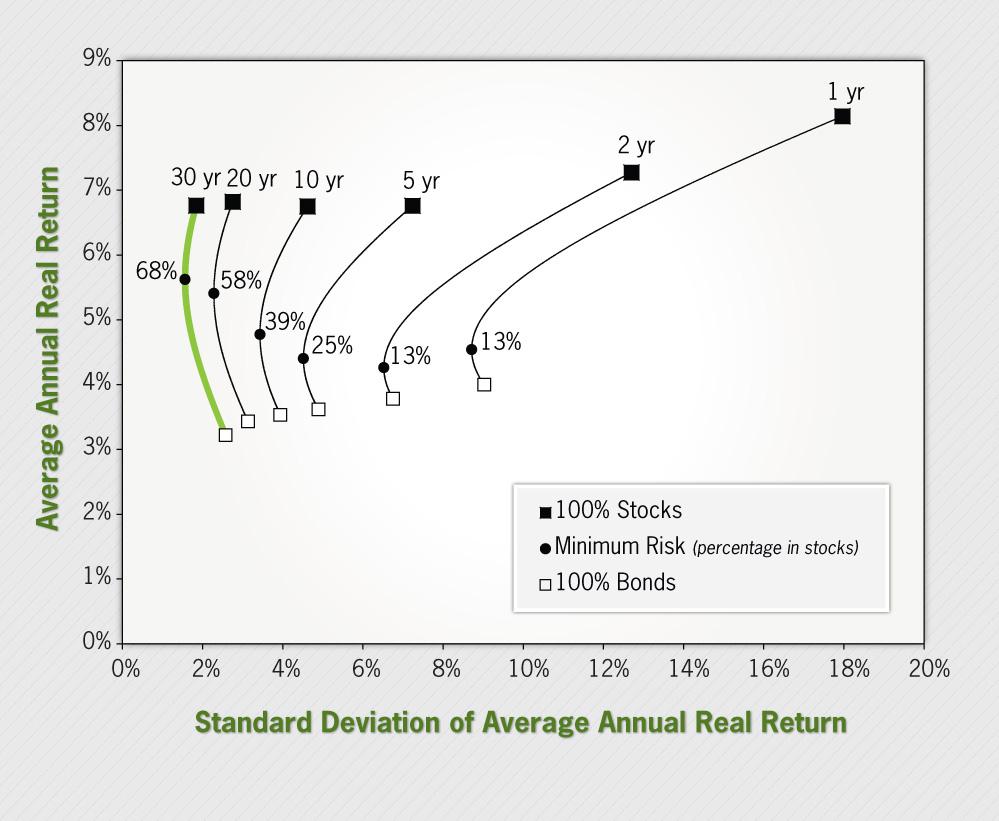
Jeremy Siegel, author of “Stocks for the Long Run“, had an article in the latest issue of the “AAII Journal” (American Association of Individual Investors) entitled “Real Returns Favor Holding Stocks.” The full article is a benefit available for members only, but perhaps the best part of the article was a chart showing the risk/return trade-offs (efficient frontiers) for stocks and bonds over various holding periods (1980-2012):
There are several important lessons to learn from this graph.
- “Real Return” is the return over inflation. On average, the real return of bonds is about 3% and the average real return of stocks is about 6.5%. So if inflation runs 4.1%, on average bonds would return 7.1% and stocks would return 10.6%.
- Although stocks are volatile during any given year, they are not volatile over longer holding periods.
- These curves bow up and to the left, especially over shorter time periods. That means there is a rebalancing bonus for a blended portfolio which will either boost returns or decrease volatility.
- Over a 30 year time horizon, an all stock portfolio is less volatile than an all bond portfolio.
- Over long periods there is a reversion to the mean. That means if stocks have done poorly recently, they should not necessarily be avoided. Rebalancing means moving out of stocks when they have done well and into stocks when they have done poorly. Long term investors should use dips in the market as buying opportunities and markets which have risen as an opportunity to replenish their bond portfolios.
- The lowest volatility for a 30 year time horizon is 68% stocks and only 32% bonds.
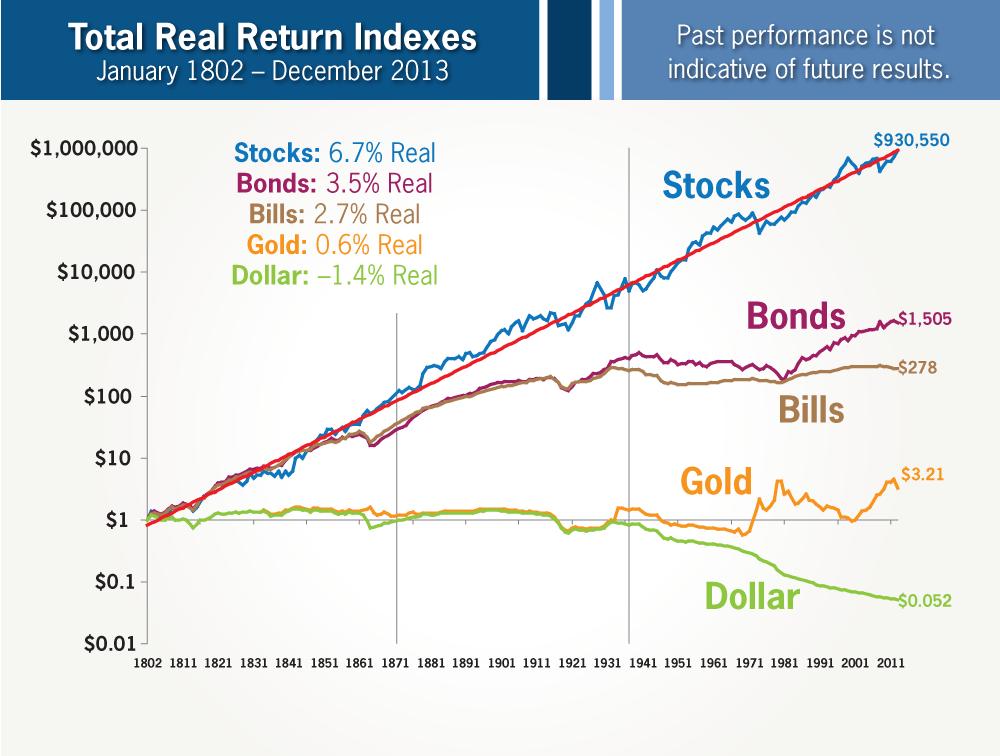
Here is Jeremy Siegel’s updated real return indexes from 1802 through 2013:
As you can see from this graph, investing mostly in bonds means having a lower lifestyle in retirement. And over many time periods longer than a few year, cash is the riskiest investment.
Portfolio construction is not best made on a whim or a hunch. Portfolio construction is more science than art.

