 The lower the market falls, the more important it is to stay invested.
Short-term returns should not ruin a brilliant long-term investment strategy. Rebalance your portfolio by selling what has gone up and buying what has gone down.
If you can’t stomach rebalancing your portfolio, at least continue to hold. Don’t lose heart and abandon the plan. There is no amount of time or percentage loss after which it is better to give up, sell, and go to cash.
It is better to simply remain calm and stay invested.
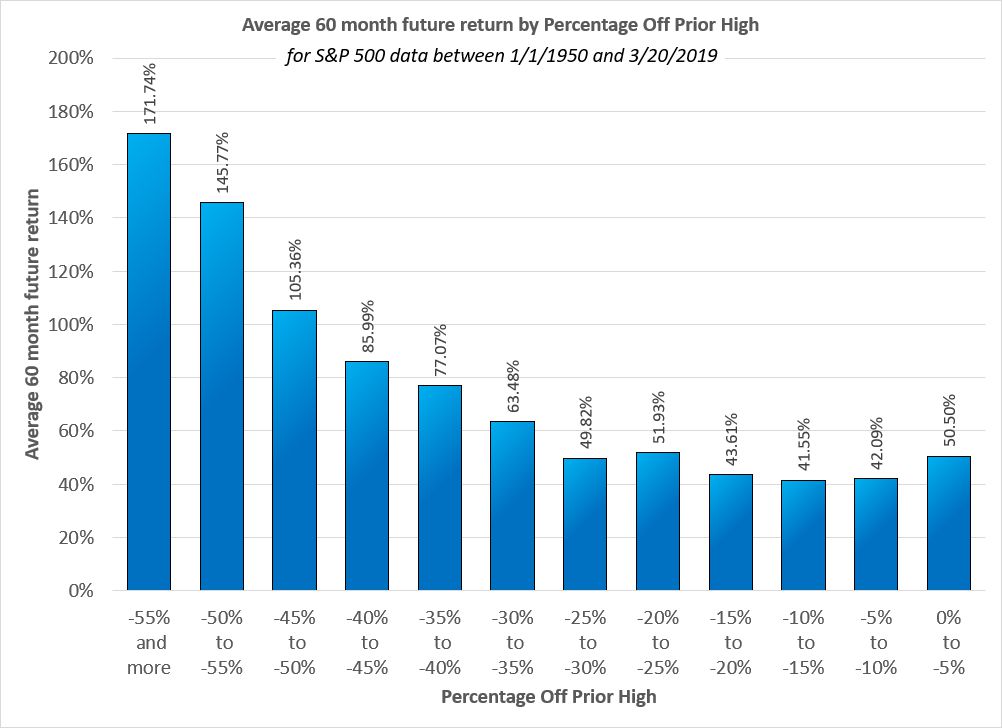
To illustrate that recommendation, here is the average future return of the S&P 500 for the next five years (60 months) grouped by the percentage the S&P 500 that was down from some prior high at the start:
As the market drops 20% below its last high, the expected 5-year future return rises. Interestingly, the more significantly the market drops the greater the average 5-year future return becomes.
If the market is not currently making a new high, the market is by definition down from some prior high. The market is on average down between 10% and 15% from some prior high. This range is also the lowest average 5-year (60 month) future return.
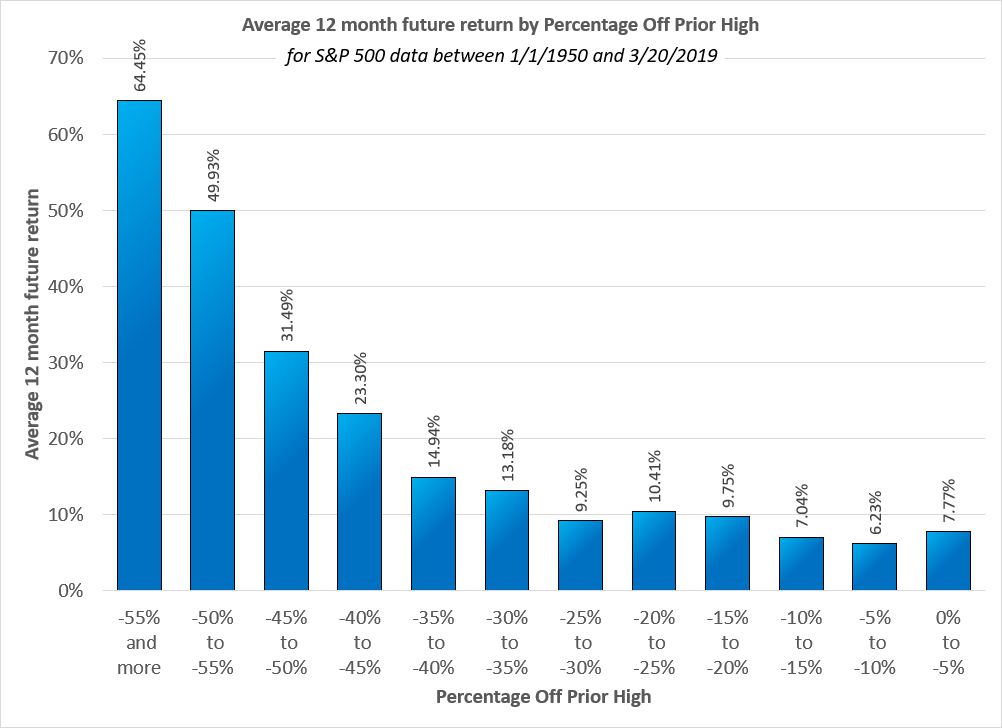
For those who think 5-years is too long a time horizon, the effect is similarly pronounced for the subsequent 1-year (12 month) future return:
No matter how far the market falls, we would recommend that you stay invested.
Investing has a higher expected return after a Bear Market. Money invested after a Bear Market is some of the most important money to remain invested. As value investor Shelby Davis is quoted to have said, “You make most of your money in a bear market; you just don’t realize it at the time.”
Staying in the markets is the number one financial action to prioritize during a market downturn. Tax loss harvesting as well as saving and investing more are also good things to consider. Roth conversions can also be more valuable. And at a minimum you can rebalance your portfolio.
While we can define a Bear Market as 20% down from the last high, we can’t define a Bull Market from some prior low. The last low is when the stock market first opened. You can’t measure how far up the market is from some prior low, because on average the market goes up. The further back you go, the more the market has gained from that point. The market can set new highs, but there is no such thing as a new low. As a result, Bull Markets are simply defined as the time between Bear Markets.
The definition of a Bear Market as down 20% has not helped investors to remain calm and stay invested.
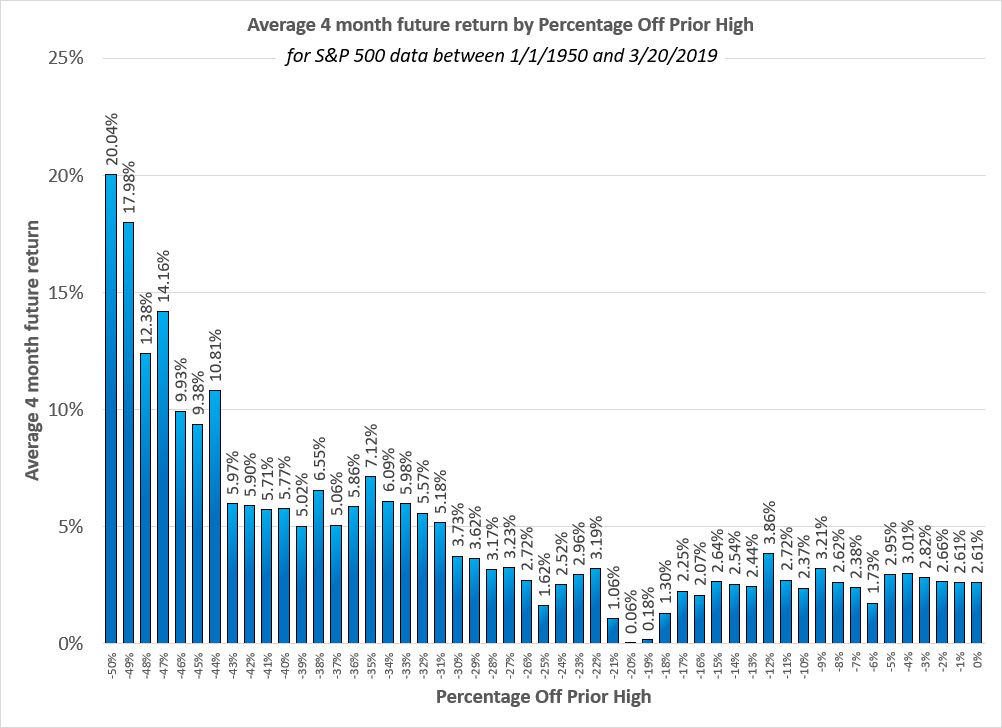
People often panic around a Bear Market. While the 5-year and 1-year average future returns are positive, very short-term movements can look negative once the market is near being down exactly 20%. When you break the percentage off a prior high down into 1% increments and you shorten the future average return time period to 3 months or less, the range of down 19% but less than 21% has a negative expected return. The idea is that when the S&P 500 approaches and then crosses the definition of a Bear Market, the financial news so completely covers the subject that they artificially push returns lower.
While 3 months or less in this range has a slight negative average return, 4 and 5 months is very close to zero, and 6 months and longer becomes nicely positive.
Here is the chart for the average 4-month future return by percentage off a prior high:
You can see the panic effect in the -19% to -21% range.
During portfolio construction, we look for an asset allocation strategy which gives an investor the best chance of meeting their long-term goals. The ability to stay the course and remain invested is the purpose of every “risk tolerance” questionnaire. So long as you don’t sell stocks when they are down, and you have enough in bonds to weather 5 to 7 years of safe spending your portfolio should behave normally.
If you were to panic, sell stocks, and go to cash or bonds, your retirement goals could be in jeopardy. Selling stocks during a downturn in the markets risks locking those losses in and failing to experience the hopefully inevitable recovery. We call this possibility “flatlining.”
Here is a logarithmic chart of the returns of the S&P 500 since the late 1970s. A logarithmic chart shows exponential growth as a straight line in order to more easily illustrate the consistent compounding growth of the markets. On that chart I have shown in red the potential impact of selling stocks at a relative low and going to cash.
Selling and going to cash at any of these relative low points in the market would have a devastating effect on your portfolio, even after the markets recovered. Having sold, the losses would be locked in.
A recovery after a significant downturn in the markets is often marked by steep growth. If you sell and flatline, you will likely miss the market’s natural recovery and thus your own personal future recovery becomes very difficult.
It is better to simply remain calm and stay invested.
Photo by Luke Carliff on Unsplash


