Keynesian economists have cited the rising U.S. stock market as evidence that the economy is picking up steam. Then they’ve been surprised by the unemployment and lack of hiring. The stock market, despite record highs, is not correlated to the performance of the overall economy.
The misery index is an economic indicator of unemployment plus inflation. Together these two measurements represent significant economic hardship for the country. The misery index was used frequently during the Nixon, Ford and Carter years as a scorecard to show how government policy can harm working people.
In December, the official unemployment rate decreased to 6.7%. But this was not really good news.
In the United States, we need to add a minimum of 127,000 jobs per month* just to account for our annual population increase. Last month, only 74,000 jobs were added, the lowest increase since January 2011. Of those, 55,000 were added in the retail sector during the holidays. With so many unemployed experienced workers, many recent college graduates are left chasing too few rookie positions.
The purported decrease in unemployment largely reflects how the government measures it. The unemployment rate only describes people who are currently working or looking for work.

During particularly bad times, the unemployment rate frequently decreases by the number of people dropping out of the jobs market entirely. In December, the job participation rate fell to 62.8%, its lowest level in 35 years. According to Heidi Shierholz of the Economic Policy Institute, if these missing workers were included in the calculation, the unemployment rate would be 10.2%.
Unemployment has never been measured very accurately. Calculations do not count those who have just entered the labor force and haven’t found a job yet, who have been searching for employment so long they have given up the search, who work part time but are actively seeking full-time work and who are actively seeking employment but were not included in the monthly jobs survey.
Unemployment in its truest definition, meaning the portion of people who do not have any job, is 37.2%. This number obviously includes some people who are not or never plan to seek employment. But it does describe how many people are not able to, do not want to or cannot find a way to work. Policies that remove the barriers to employment, thus decreasing this number, are obviously beneficial.
In contrast, officially reported unemployment numbers decrease when enough time passes to discourage the unemployed from looking for work. A decrease is not necessarily beneficial; an increase is clearly detrimental.
So how could our stock market be at such record highs while so many are unemployed? Given current government policies, it is specifically by avoiding U.S. workers that companies are keeping their profits strong. Obamacare punishes large companies for each full-time worker and provides strong incentives for small businesses to stay below 50 full-time-equivalent employees. Automation and outsourcing are making U.S. companies more profitable at the expense of U.S. employment.
Inflation, the other half of the misery index, assists stock prices as well. Every month, the Federal Reserve has been injecting $85 billion into the money supply. This devaluation of the currency causes inflation that naturally pushes all prices, including stock prices, higher.
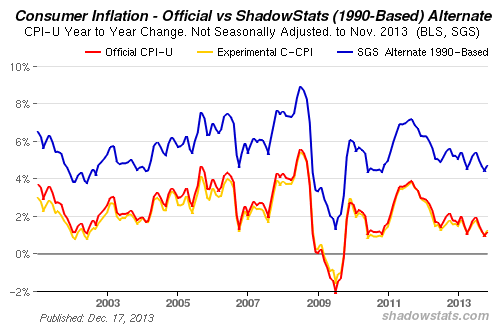
The broadest measure of inflation is the Consumer Price Index. But since 1997, the government has manipulated the raw data and significantly underreported inflation. Now they use a “hedonic deprecator.” If the quality of a commodity increases more than its price, the quality increase is counted as deflation. And because consumers use “creative substitution,” switching from an expensive good to a similar but cheaper good, the government argues that only a portion of price increases should be counted as inflation.

These tricks, along with a host of other dubious accounting schemes, underreport inflation by about 3%. Today, inflation is officially 1.24%. According to Shadow Stats, which computes the old way, it is closer to 4.5%.
Think of that 4.5% of actual inflation as a tax on anyone who is storing their money in dollars. And since 1997 that 3% annual underreporting has had the effect of cutting Social Security benefits by a cumulative 40%.
Today, the misery index would be 7.54 using official numbers. Using Shierholz’s measurement including discouraged workers (10.2%) and the historical method of calculating inflation (4.5%), the current misery index is closer to 14.7, worse even than during the Ford administration.
The younger and more economically disadvantaged members of society feel the misery most acutely. But the economics is much more complex than adding laws to help them directly. Longer unemployment benefits or subsidized government-run health care contribute to systemic government policies that discourage production and employment.
Meanwhile, the stock market can occasionally benefit from the misery index. It does not correlate to an economic recovery but is a powerful financial asset for those wise enough to remain invested and diversified during all kinds of economic movements.
*NOTE: Several people wrote to suggest that the number of new jobs which need to be added because of population growth is much higher than Paul Krugman’s 127,000 jobs per month. We agree which is why we used that figure as a “minimum.”
Photo by Fiona McAllister used here under Flickr Creative Commons.